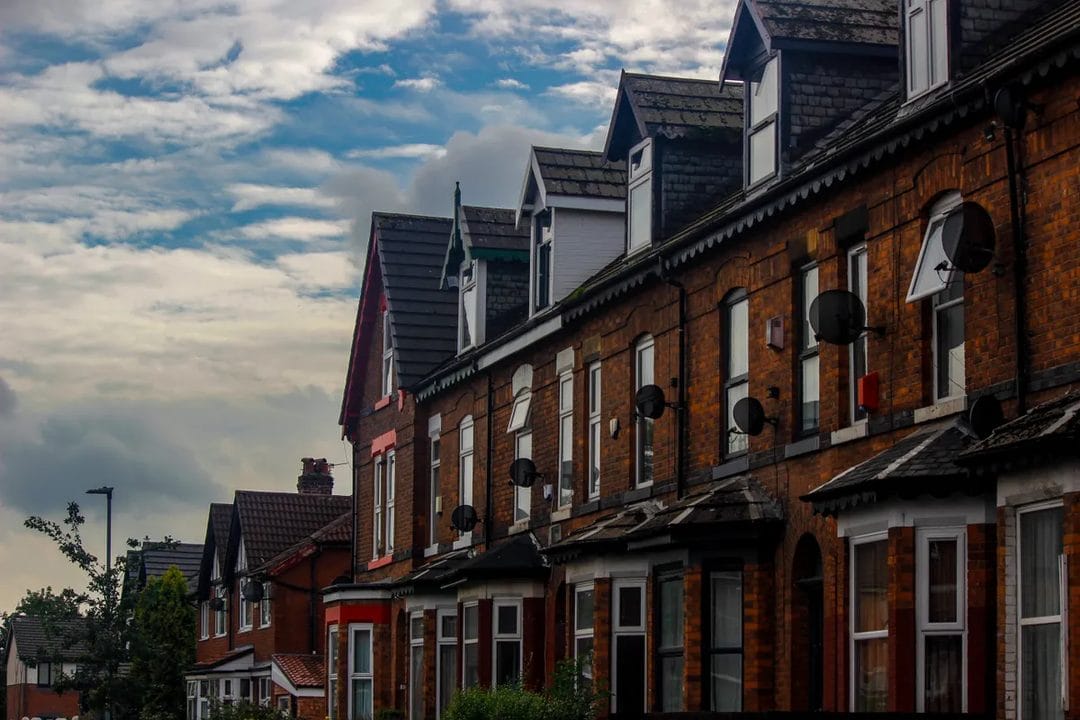
The cheapest region in Britain to buy a house is also, right now, one of the fastest-growing. Average prices in the North rose 3.9% in the year to June, according to Nationwide's second-quarter regional index, while London — the country's most expensive market by a wide margin — managed just 1.6%. Move further into the Home Counties and the picture gets stranger still: the Outer South East, that ring of commuter towns from Kent to Hampshire, recorded annual growth of 0.1%. A market that has spent three decades rewarding anyone who bought south of Birmingham has, for now, turned itself inside out.
The Numbers Nationwide Is Recording
Nationwide's Q2 2026 regional house price statistics, covering the three months to June, put the average UK property at £278,784, up 2.2% year on year. Strip out the national average, though, and the regional spread tells the real story. Northern England — the North, North West, Yorkshire & the Humber, the East Midlands and the West Midlands taken together — grew 3.1% over the year. Southern England, covering the South West, Outer South East, Outer Metropolitan, London and East Anglia, managed 0.7%. The North West was the strongest-performing English region outright, up 3.9% to an average of £231,415, while the Outer South East brought up the rear at 0.1%, with an average price of £341,175. Northern Ireland sits above everything, up 8.6% to £226,699, though its growth rate has actually cooled from 9.5% the previous quarter.
Look at the same data month by month and the direction hasn't shifted. Nationwide's monthly index showed UK annual growth easing from 2.2% in June to 1.8% in July, with the average price ticking up marginally from £277,484 to £277,542. Robert Gardner, Nationwide's chief economist, pointed to a wider economic backdrop rather than anything housing-specific: geopolitical tensions, he noted, including the conflict between Iran and the US, have kept upward pressure on energy prices and market interest rates in recent weeks, and that has fed through into a softer housing market generally. What that softening has not done is close the North-South gap. If anything, a slower national market has made the regional divergence more visible, because there is less overall momentum for the South's usual pull to override.
Affordability Headroom Explains Most of It
None of this is really a mystery once you look at the starting prices. A three-bedroom semi in the North currently averages £173,756 against a Nationwide-tracked average UK wage that has grown roughly in line with inflation over the past two years — which means a mortgage on that property, even at current rates, still leaves meaningful headroom against affordability stress tests. In London, where the average property is £540,903, that headroom simply doesn't exist for most buyers without a deposit well above the national norm, a guarantor, or family help. Lenders' affordability calculations — typically capping borrowing at 4 to 4.5 times household income, with an added stress-test buffer of several percentage points above the applicant's actual mortgage rate — bite hardest exactly where prices are already stretched relative to local wages. A buyer stretching to the top of that borrowing multiple in the North still keeps a reasonable buffer against a rate rise or a rocky month at work; a buyer doing the same in the Home Counties frequently has no buffer left at all. That is the South East, the Outer Metropolitan ring and, above all, London itself.
Buyers priced out of the capital have also had somewhere obvious to go. The North West in particular — Cheshire, Lancashire, Greater Manchester — offers commuter rail links into major employment centres, a growing base of relocated financial and tech-sector jobs around Manchester and Salford, and prices that, even after 3.9% annual growth, remain roughly 40% of London's average. First-time buyers weighing whether to keep saving for a flat in outer London or move to a house near Manchester should take the North seriously rather than treating it as a fallback: the numbers now genuinely favour it, not just on price but on the mortgage you'd actually qualify for.
The Northern Ireland Exception
There is a catch worth flagging before this turns into too tidy a north-good, south-bad story. Northern Ireland's 8.6% growth is running well ahead of anywhere in England, but it is coming off a much lower base and reflects a market recovering from years of underbuilding relative to household formation, not a straightforward affordability story like the North West's. Housebuilding completions in Northern Ireland have lagged behind the rest of the UK for over a decade, and that supply shortfall — rather than a wave of buyers fleeing expensive markets elsewhere — is doing most of the work on prices there. Lump it in with the North West's growth and you flatten two genuinely different stories into one convenient headline.
Why the South East Has Nearly Stopped Moving
The Outer South East and Outer Metropolitan regions — the commuter belt around London, roughly Surrey, Kent, Berkshire, Essex and Hertfordshire — have been the weakest performers in the country for two consecutive quarters now, at 0.1% and 0.3% annual growth respectively. Part of this is simple arithmetic: these are the second and third most expensive regions in the country, at £341,175 and £432,173 on average, so the same stress-test constraint that pushes buyers north also pushes South East buyers to reconsider whether they can actually afford to move up the ladder within their own region. Part of it is the stamp duty band structure, which applies its steepest marginal rates to exactly the price range that dominates commuter-belt family homes, adding a real cost that doesn't apply in the same way to a £230,000 house in the North West.
London itself is a slightly different case again — its 1.6% growth is soft but positive, and it remains, by Nationwide's own fact file, both the most expensive region in the UK and the strongest performer within the South. What has genuinely stalled is the ring around it (anyone who has watched a well-presented three-bed in Reading or Guildford sit unsold since the spring will recognise the feeling), where buyers are neither cheap enough to attract first-time-buyer volume nor central enough to hold the premium that justifies London prices. If you're selling a four-bedroom house in the Outer South East this autumn, price it against what's actually completing locally rather than against 2021-2022 peak comparables — agents in these areas report longer void periods between listing and offer than at any point in the past three years, and an overpriced listing sitting unsold for months does more damage to your eventual sale price than a realistic asking price from day one.
The Asking Price Picture Tells a Similar Story
Rightmove's July index, which tracks newly listed asking prices rather than completed sales, adds a forward-looking layer to the same pattern. The national average asking price fell 1.0% in July to £372,359 — a bigger drop than the ten-year average for the month, which Rightmove attributed partly to summer distractions and partly to a supply of available homes sitting near a 12-year high for the time of year. Regionally, only three areas recorded month-on-month asking price growth in July: Yorkshire and the Humber, the North West, and Wales, each up a modest 0.2–0.3%. Everywhere else, sellers were trimming asking prices to compete for a shrinking pool of active buyers, and London's average asking price of £676,248 sat well above its own transacted average from Nationwide's index — a gap that typically closes through offers well under the asking figure rather than through sales at it.
What This Means If You're Buying, Selling, or Letting
For buyers, the practical takeaway is to stop benchmarking value against national averages, which flatten two housing markets moving in opposite directions into one meaningless number. A first-time buyer comparing a flat in Reading against a house in Preston is not making a like-for-like decision on the same underlying market; they are choosing between a market where prices have been essentially flat for a year and one growing at nearly 3% with a lower entry cost to begin with. For sellers in the South East and Outer Metropolitan ring specifically, the sensible move is to accept that the seller's-market pricing power of 2021 has not returned and probably won't this year — list at a price that reflects current completions on your street, not the estate agent's most optimistic comparable from three years ago.
- Check the actual Nationwide or ONS regional figure for your specific area before accepting an estate agent's valuation — regional averages can mask significant town-to-town variation even within the same broad category.
- If you're a first-time buyer stretching to afford the South East, run the numbers on a North West or Midlands alternative before committing; the mortgage you'd qualify for changes the calculation, not just the sticker price.
- Landlords with stock in the Outer South East should budget for longer void periods between tenancies this year, not just softer capital growth.
The Landlord Angle: Yields Follow the Same Split
Buy-to-let investors have quietly been drawing the same conclusion for longer than most owner-occupiers, because rental yield math punishes expensive, slow-growing markets twice over — once on the purchase price and again on the weaker capital appreciation that used to offset a modest yield. A landlord buying in the North West today is paying roughly £100,000 less for a comparable property than in the Outer Metropolitan region, while collecting rent that has kept pace reasonably well with regional wage growth in cities like Manchester and Liverpool. That combination of lower entry price and steadier annual growth is precisely why the North West, the North and parts of Yorkshire have absorbed a disproportionate share of buy-to-let purchasing activity over the past two years, even before accounting for the additional stamp duty surcharge landlords pay everywhere, which stings proportionally less on a cheaper property.
None of this means the South East or Outer Metropolitan markets are bad long-term holds — London and its surrounding ring have recovered from flat patches before, and the underlying demand from people who need to work in or near the capital hasn't gone anywhere. But an investor buying today on the assumption that Home Counties capital growth will simply resume its old pattern is betting against what two consecutive quarters of Nationwide data, and Rightmove's asking-price trend alongside it, are actually showing. The safer bet this year is the one the numbers are already pointing at, not the one that used to work.